Our mission is to connect raw data to real decisions. Dealing with large data sets can often be overwhelming and inconclusive. With advanced techniques we present a simplified option to find the meaning in your data. Not only can we interperet your data but we strive to give presentable results by analyzing, testing, and visualizing
Data Driven Decisions
Data Driven decisions are how firms determine their next venture. The decision move to a new market, advertise to a dominant demographic, or visualize existing data. Data driven decisions use math and statistics to give accuracy in a choice.
Data will reveal potential risk and show anomalies in regions of your business. Pin Pointing these will inevitably save you time and money.
What do we do
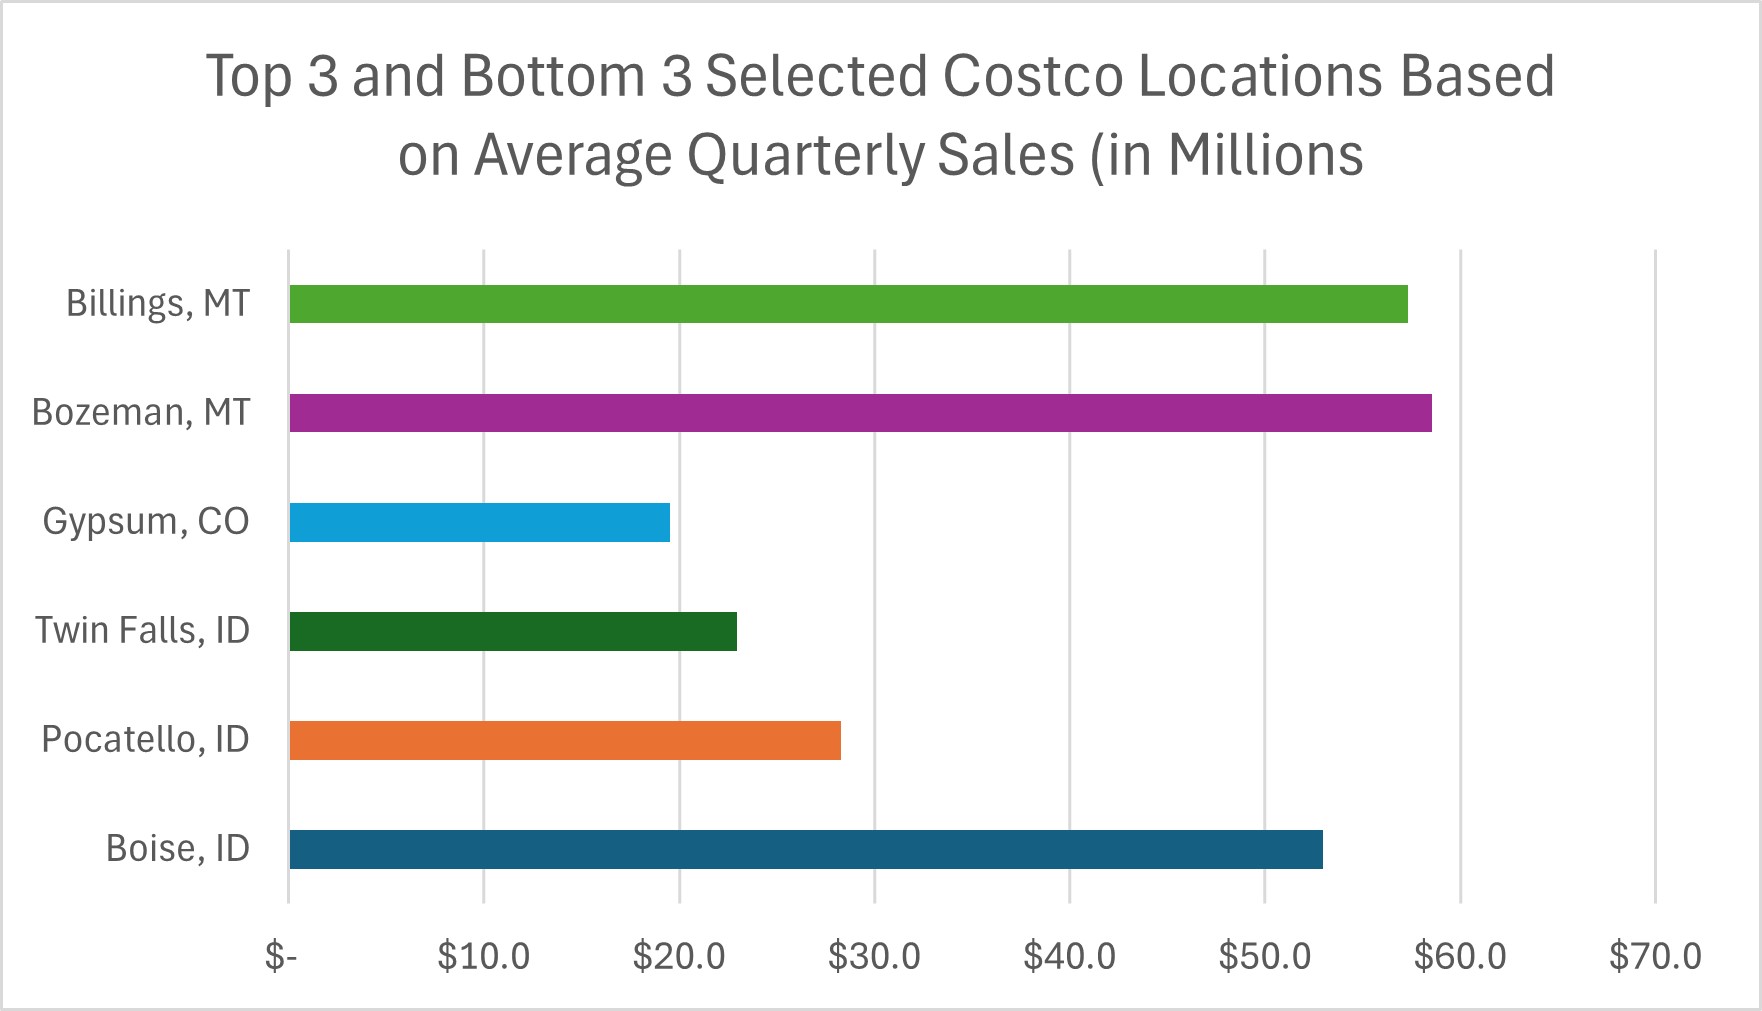
Data Visualization
Overview of visualization
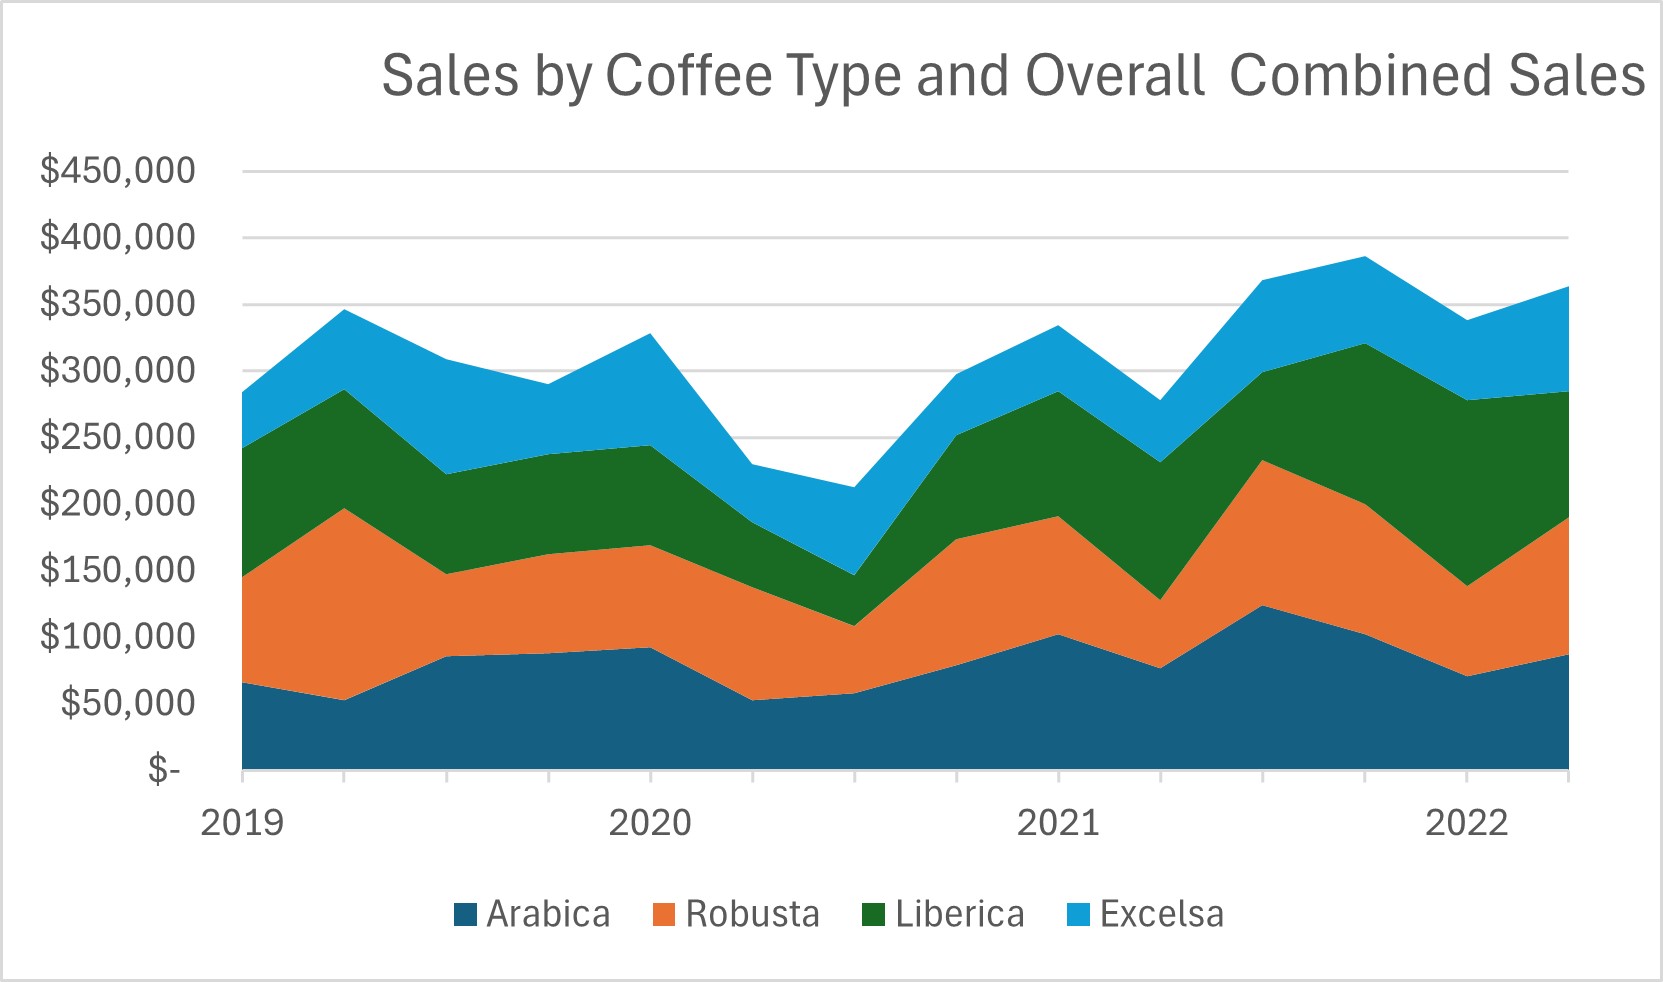
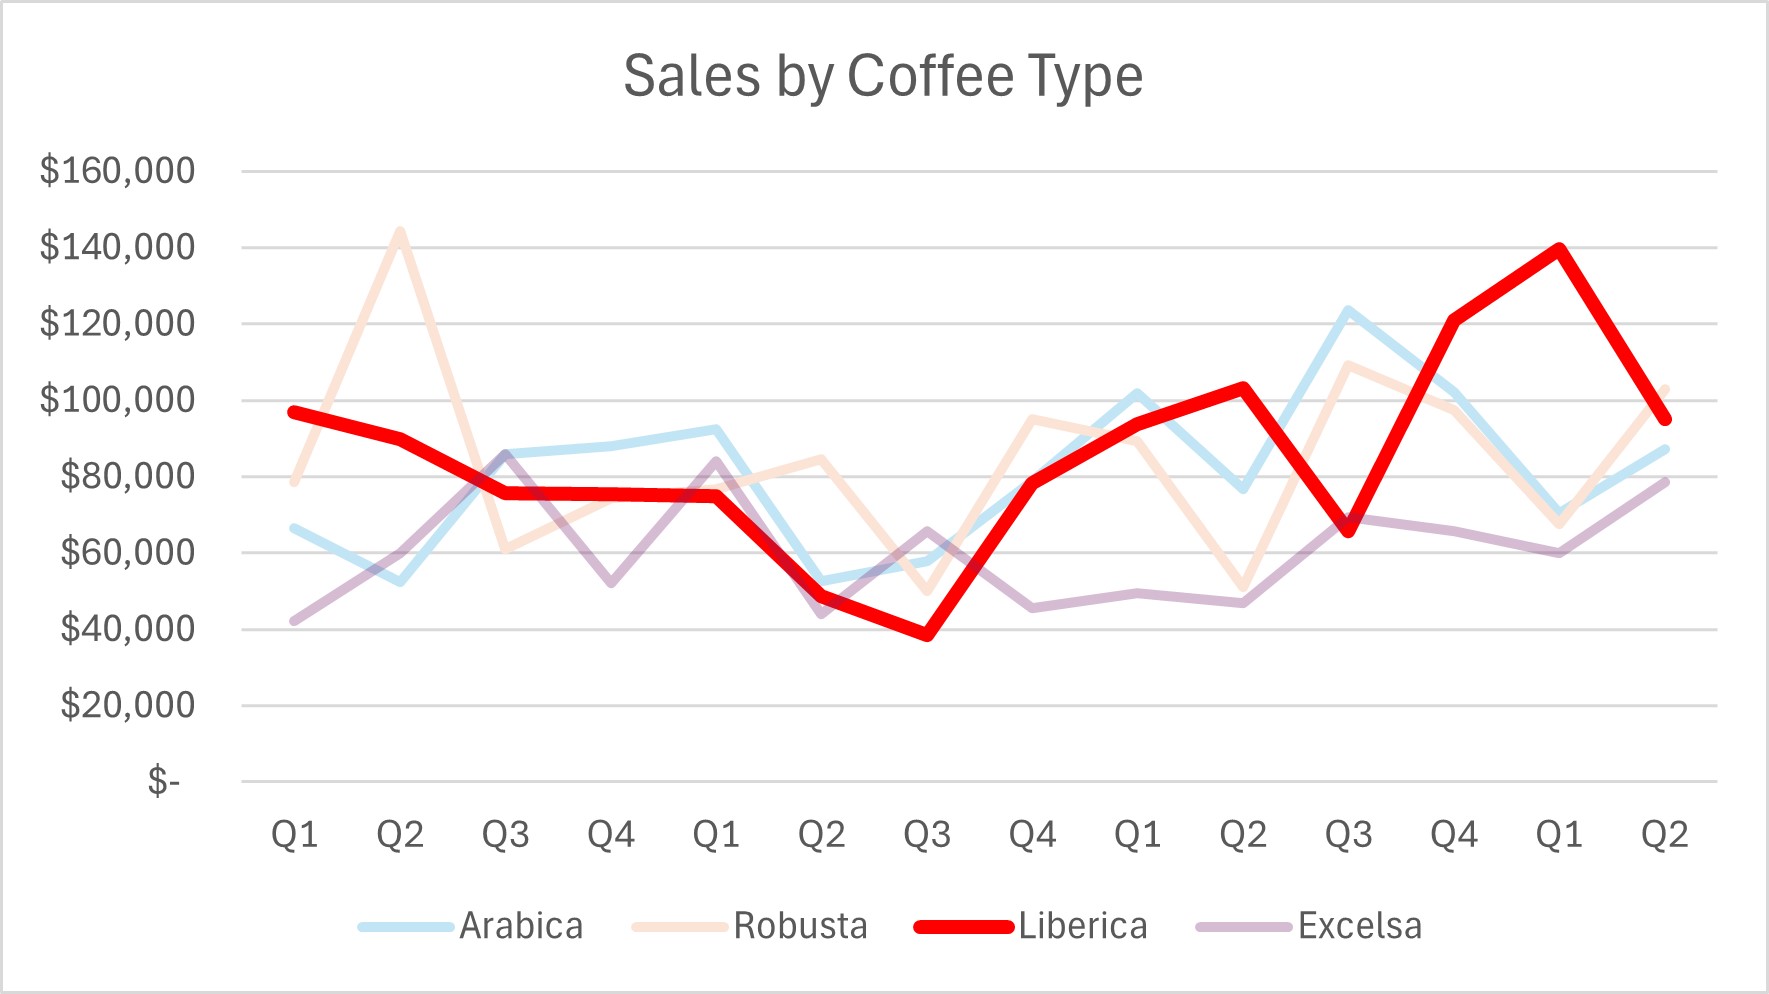
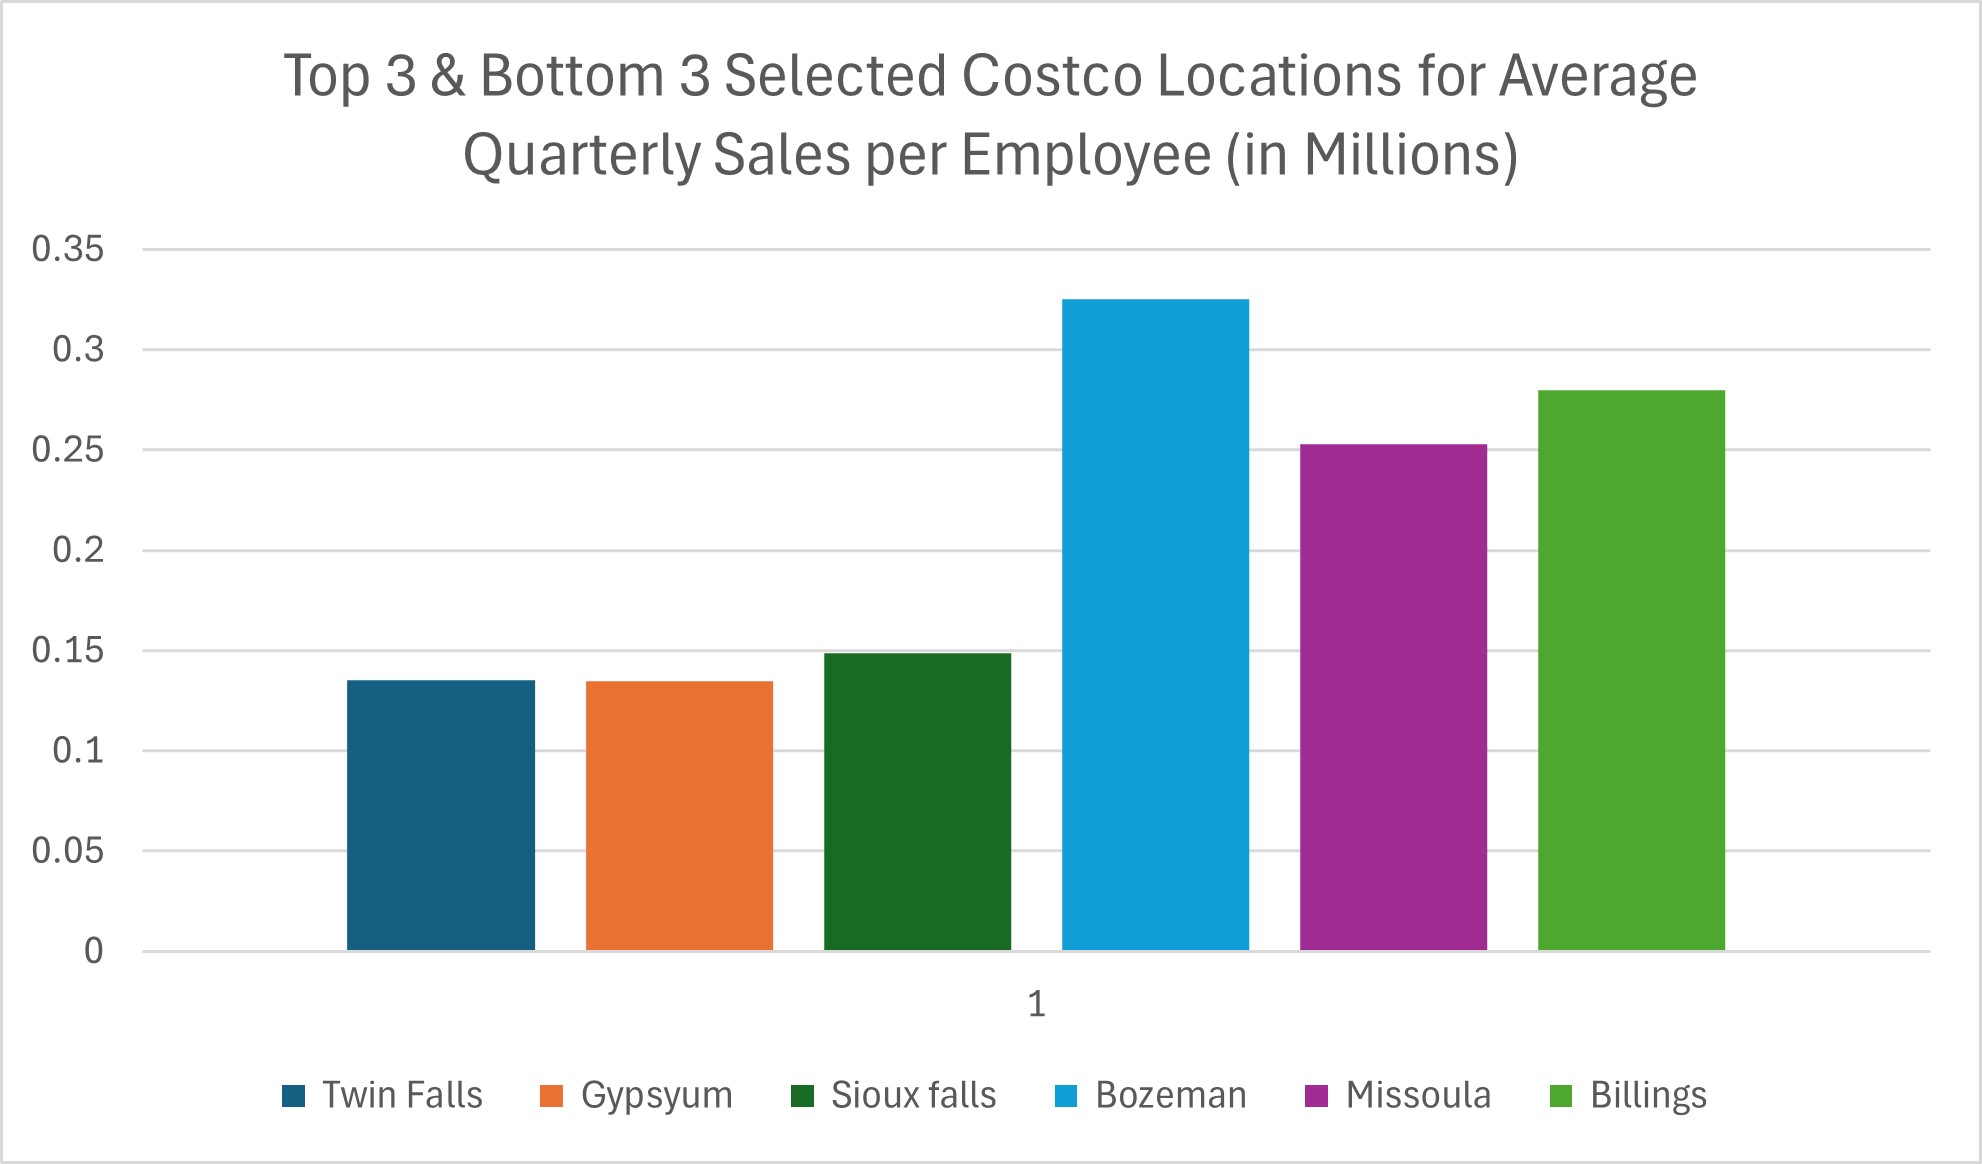
Data visualization is the usage of graphs and charts to correctly represent data sets. We sort through and assign specific data points to certain graphs that will accurately represent the meaning of the data.
Types of graphs
There is no one-solution-fits-all graph. To understand the necessary graph, you must first understand what you’re trying to represent.
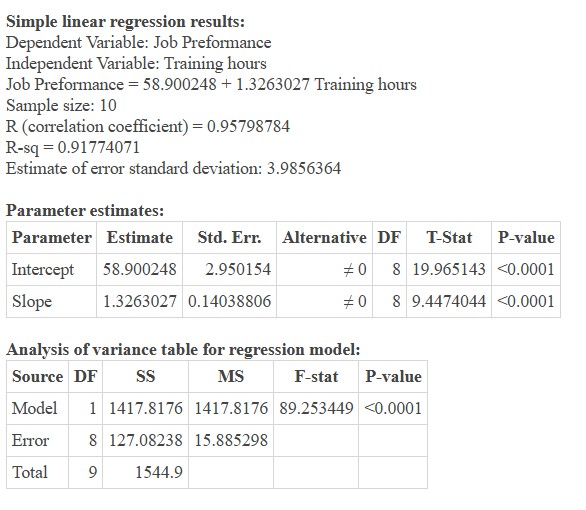
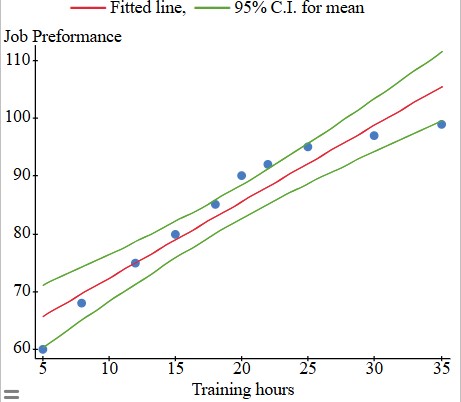
Data Anayltics
Overview of Data Analytics
Analyzing data requires a sophisticated understanding of statistics. Apply the correction techniques to certain datasets proves to be incredibility important.
Using Statistics
On the requirement that statistics is necessary, we prepare a statistics report and provide all relevant results. Results will determine accuracy, which will then be used to back up our hypothesis regarding your data
Data Storytelling
Overview of Data Storytelling
Data storytelling is the highest level of interpretation. Once all the data has been cleaned, tested, and put into a presentation we will prepare a written report to explain what everything means. We know how confusing data can be, so we are prepared to meet online, or communicate until your data makes sense to you.
We don’t expect you to understand the technical terminology. With that said, we are always a resource if you questions about your data.
What to expect
Getting started
First, we will start by getting in contact in whichever medium works best for you. We will discuss your goals and what your expectations our. Hopefully after first contact you will be aware of what you are getting and should have a solid understanding of what will be happening behind the scenes
Getting to work
Once we have finished discussing what needs to happen our job really starts. We dig into your data and uncover the secrets. A presentation will be prepared to formally portray the findings and walk you through the results and technical aspects.
The Final Result
Finally, after awaiting the results a copy of your results is emailed to you for your own keeping. If desired another meeting with be arranged to discuss the meaning of the more complicated findings. at first glance, understanding the results may seem overwhelming so our inbox is always open to questions.